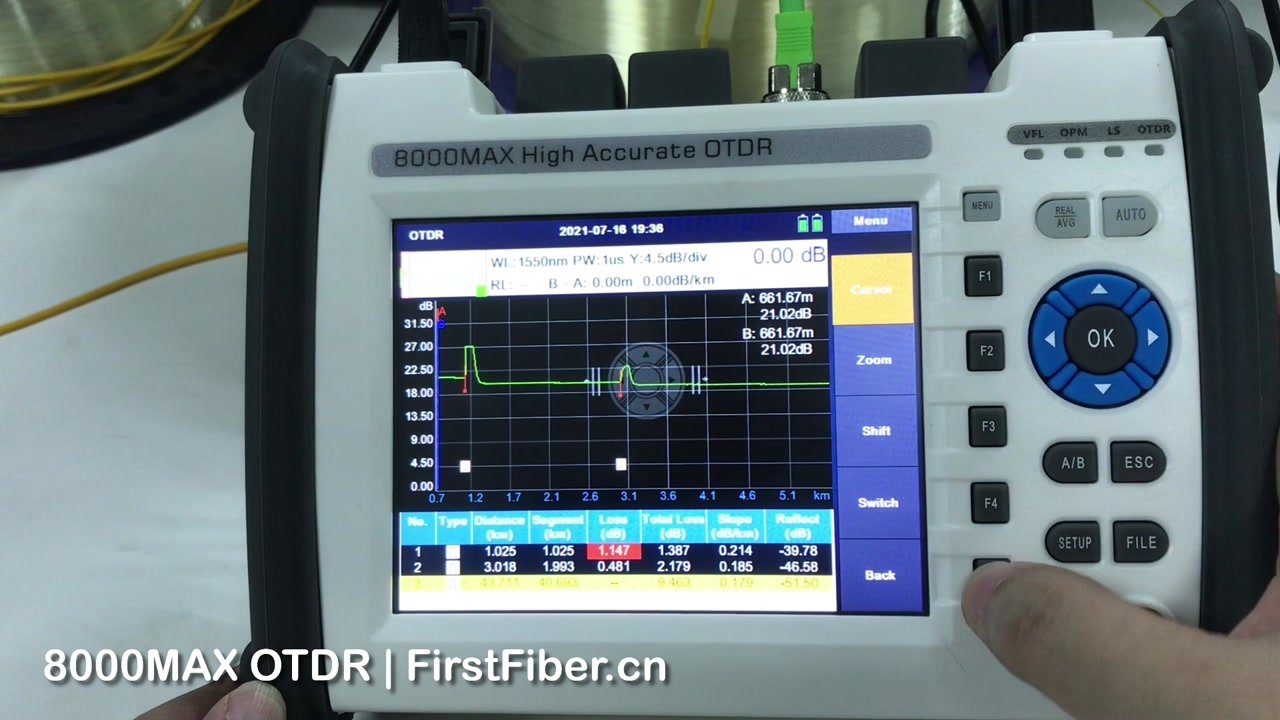
As the “radar” of fiber optic networks, the design of an Optical Time-Domain Reflectometer (OTDR) is far more than a simple optical-to-electrical conversion. Under the Direct Detection architecture, it represents an ultimate balancing act between weak signal extraction, high-speed analog front-end design, clock jitter control, and highly complex underlying mathematical algorithms.
Starting from fundamental physical models and following the flow of optical and electrical signals, this article provides a comprehensive breakdown of OTDR working mechanisms, hardware bottlenecks, and the mathematical-physical models of core DSP algorithms embedded in the firmware. The goal is to provide a systematic, low-level design perspective for OTDR R&D engineers.
Physical Layer Foundations: Mathematical Models of Optical Scattering and Reflection
The essence of an OTDR is to derive spatial distance through time measurement and to deduce the physical characteristics of the optical fiber through optical power variations. The signals processed at the receiver end primarily originate from two optical phenomena: Rayleigh Backscattering and Fresnel Reflection.
The Rayleigh Backscattering Radar Equation
At a given time , the weak backscattered optical power received by the OTDR can be expressed by the optical radar equation:
: Peak power of the laser pulse.
: Optical pulse width.
: Group velocity of light in the fiber.
: Capture Fraction, the proportion of scattered light that can be guided by the waveguide and transmitted back to the source, which is extremely low in single-mode fibers.
: Total attenuation coefficient of the optical fiber.
R&D Considerations: Because is extremely small, the backscattered optical power is typically to lower than the incident light, demanding extremely high sensitivity at the receiver. Meanwhile, is directly proportional to the pulse width , which poses a fundamental physical contradiction between dynamic range and spatial resolution.
Fresnel Reflection and the Origin of Dead Zones
When light encounters a surface with a refractive index discontinuity, Fresnel reflection occurs. The reflectance $R$ depends on the refractive index difference:
The reflectance from a silica fiber to air interface is approximately (about ). The intensity of Fresnel reflection is over higher than Rayleigh scattering. This instantaneous strong optical transient drives the photodetector and front-end amplifier into non-linear saturation. The time it takes for the hardware to recover from saturation to a linear amplification state constitutes the OTDR’s Dead Zone.
Core Hardware Architecture: The Transmitter and Analog Front-End (AFE) Trade-offs
Laser Diode & Driver (LD & Driver): An ideal pulse is perfectly rectangular, but in reality, the fall-time trailing edge of the driver directly stretches the Event Dead Zone (EDZ). Furthermore, the Wavelength Chirp triggered by high-speed pulse modulation can cause pulse broadening in high-dispersion links. Additionally, constrained by non-linear effects such as Stimulated Raman Scattering (SRS), R&D engineers cannot increase the peak power indefinitely.
Analog Front-End (APD & TIA): InGaAs Avalanche Photodiodes (APDs) are selected to utilize their internal multiplication factor . However, high gain introduces an Excess Noise Factor . Furthermore, the Tailing Effect—caused by the inability of carriers inside the APD to recombine instantly under intense light—is the root hardware cause of prolonged Attenuation Dead Zones (ADZ). Modern Transimpedance Amplifiers (TIAs) utilize multi-stage Variable Gain Architectures (VGA), requiring extremely low charge injection interference and ultra-precise baseline stitching algorithms.
High-Speed Data Acquisition: RTS vs. ETS Architectures
To achieve millimeter-level detection, the ADC sampling resolution must reach the nanosecond or even picosecond level.
- Real-Time Sampling (RTS): Uses ultra-high-speed ADCs (> ) to capture the full waveform in a single shot. It offers fast testing speeds but consumes high power. In low-end devices, sparse data points due to insufficient sampling rates can cause pulse edge smearing.
- Equivalent-Time Sampling (ETS): Utilizes lower sampling rate ADCs (e.g., ) by introducing a micro-step delay () with each emission. Through thousands of interleaved samples, it reconstructs a high-frequency waveform equivalent to several .
- Core Challenge: Trigger Jitter between the emission clock and the sampling clock directly causes temporal smearing. If the system jitter reaches , the equivalent spatial resolution cannot be better than .
Underlying Mathematical Algorithms and DSP Implementation
The data sequence collected by the ADC is merely raw digital information containing extremely high noise components. The key to determining core OTDR metrics lies in the back-end mathematical modeling and signal processing algorithms.
Breaking the Resolution and Dynamic Range Barrier: Golay Code Decoding
To increase the injected energy without increasing peak power, modern OTDRs use Complementary Golay codes for pulse coding. For a pair of complementary Golay sequences and of length , their autocorrelation functions and satisfy:
FPGA Decoding Implementation: The OTDR sequentially transmits sequences and , and the received backscattered signals are and . In the DSP, time-reversed sequences and are convolved (cross-correlated) with the received signals respectively and summed:
Thanks to the complementary property, sidelobe interference is perfectly canceled out, resulting in a significantly improved Signal-to-Noise Ratio (SNR) compared to a single pulse. The difficulty lies in ensuring absolute linearity of the laser driver; otherwise, sidelobes cannot be completely zeroed out.
High-Precision Extraction of Splice Loss: Matrix Formulation of LSA
For Splice Loss extraction, the OTDR must sample linear regions in the logarithmic domain on both sides of the event point and use the Least Squares Approximation (LSA) to fit straight lines.
Construct the matrix equation . The analytical solution that minimizes the sum of squared errors is:
Algorithmic Considerations: Solving massive LSA problems in real-time on embedded systems via direct matrix inversion carries tremendous overhead. Since the sampling coordinates are uniformly spaced, the matrix can be pre-computed during initialization as a constant filter coefficient, transforming the complex regression process into highly efficient Multiply-Accumulate (MAC) operations.
Pushing the Limit of Dead Zone Compression: Wiener Deconvolution
The OTDR output signal is the sum of the convolution of the transmitted pulse , the system impulse response , and the true physical distribution , plus noise . In the frequency domain, this is . To recover the sharp , a Wiener Filter is introduced:
The reconstructed fiber distribution is: . Algorithmic Considerations: When the SNR is high, this algorithm can vastly compress the pulse tail (reducing the dead zone); when the SNR is low, it automatically degrades into a low-pass filter to suppress Ringing Artifacts.
Complex Optical Anomaly Diagnostics Algorithms
Elimination of Ghost Reflections
In multi-connector links, light bounces back and forth between two highly reflective nodes, creating pseudo-reflection peaks.
Mathematical Characterization: The algorithm scans the event table and executes cross-correlation distance matching. If an event distance satisfies or and the local loss , it is labeled as a Ghost artifact and filtered out.
Dual-Wavelength Differential Characterization: Macro-bending Diagnosis
By exploiting the physical difference in Mode Field Diameters (MFD) at different wavelengths, the system can distinguish between poor splices and fiber bends.
Diagnostic Logic: Align the spatial coordinates of and traces via group refractive index compensation. Calculate the difference in LSA loss at the same point: . If exceeds a certain threshold (e.g., ), based on the rule that longer wavelengths escape the cladding more easily, it is classified as Macro-bending.
Technological Accumulation Pushing the Limits
Because the underlying design of an OTDR involves such complex hardware compromises and profound mathematical-physical algorithms, building a high-performance, highly reliable measurement instrument requires long-term, systematic engineering accumulation. From precise analog circuits suppressing APD tailing effects, to nanosecond-level timing synchronization in FPGAs, to deconvolution models resolving ringing artifacts—every detail dictates the ultimate ceiling of the product.
The technical team at FirstFiber Technologies has been deeply immersed in core OTDR algorithms and manufacturing processes for over 20 years. Armed with a profound understanding of low-level optoelectronic architectures and advanced DSP algorithms, FirstFiber Technologies not only shatters the performance bottlenecks of traditional instruments but also offers specialized customization services, dedicated to meeting the demands of the most rigorous and cutting-edge testing scenarios.